This article provides a practical guide to value streams, explaining what they are, how to identify them, and how to organize teams and architecture around them. Learn about the four flow items, measuring flow, and the architectural impact of value stream boundaries for optimal software delivery.
In software, “order” is an experience that you must own and maintain across the stages of discovery, comparison, purchase, payment, tracking, receipt, and return. Treating “order” like a one-off operation underestimates what teams and architectures must own over time.
Why value streams matter
Value streams shift attention from managing activities to managing how value moves from intent to impact, and who owns that movement end-to-end. They are the unit that enables you to organize teams, metrics, and architecture into a single, coherent socio-technical system.
Mindset shift: don’t ask “What process do we run?” Ask “What promise do we keep, for whom, again and again?” That promise is your value stream.
Definition
A value stream is a long-lived capability that repeatedly delivers a customer-recognizable outcome for a specific segment, persona, or job.
It’s defined in two dimensions:
- Horizontal (time): the end-to-end stages from trigger to value realized.
- Vertical (customer): the segments, personas, or jobs you serve (for example, SMB vs Enterprise; within Enterprise: IT Admin vs Business User).
A stream exists where a contiguous path across time for a specific customer slice produces a recognizable outcome measured by a single north-star metric. It’s more than a process: it’s a structured unit of business you can fund, staff, measure, and evolve.
Example
In Manufacturing: “Order-to-Ship” is a process lane.
In Software: “Shopper Purchase Experience” is the stream. The service where shoppers can discover → compare → purchase → receive (and return) goods successfully. One team (or set of teams) owns that experience from end to end.
Key components of a value stream
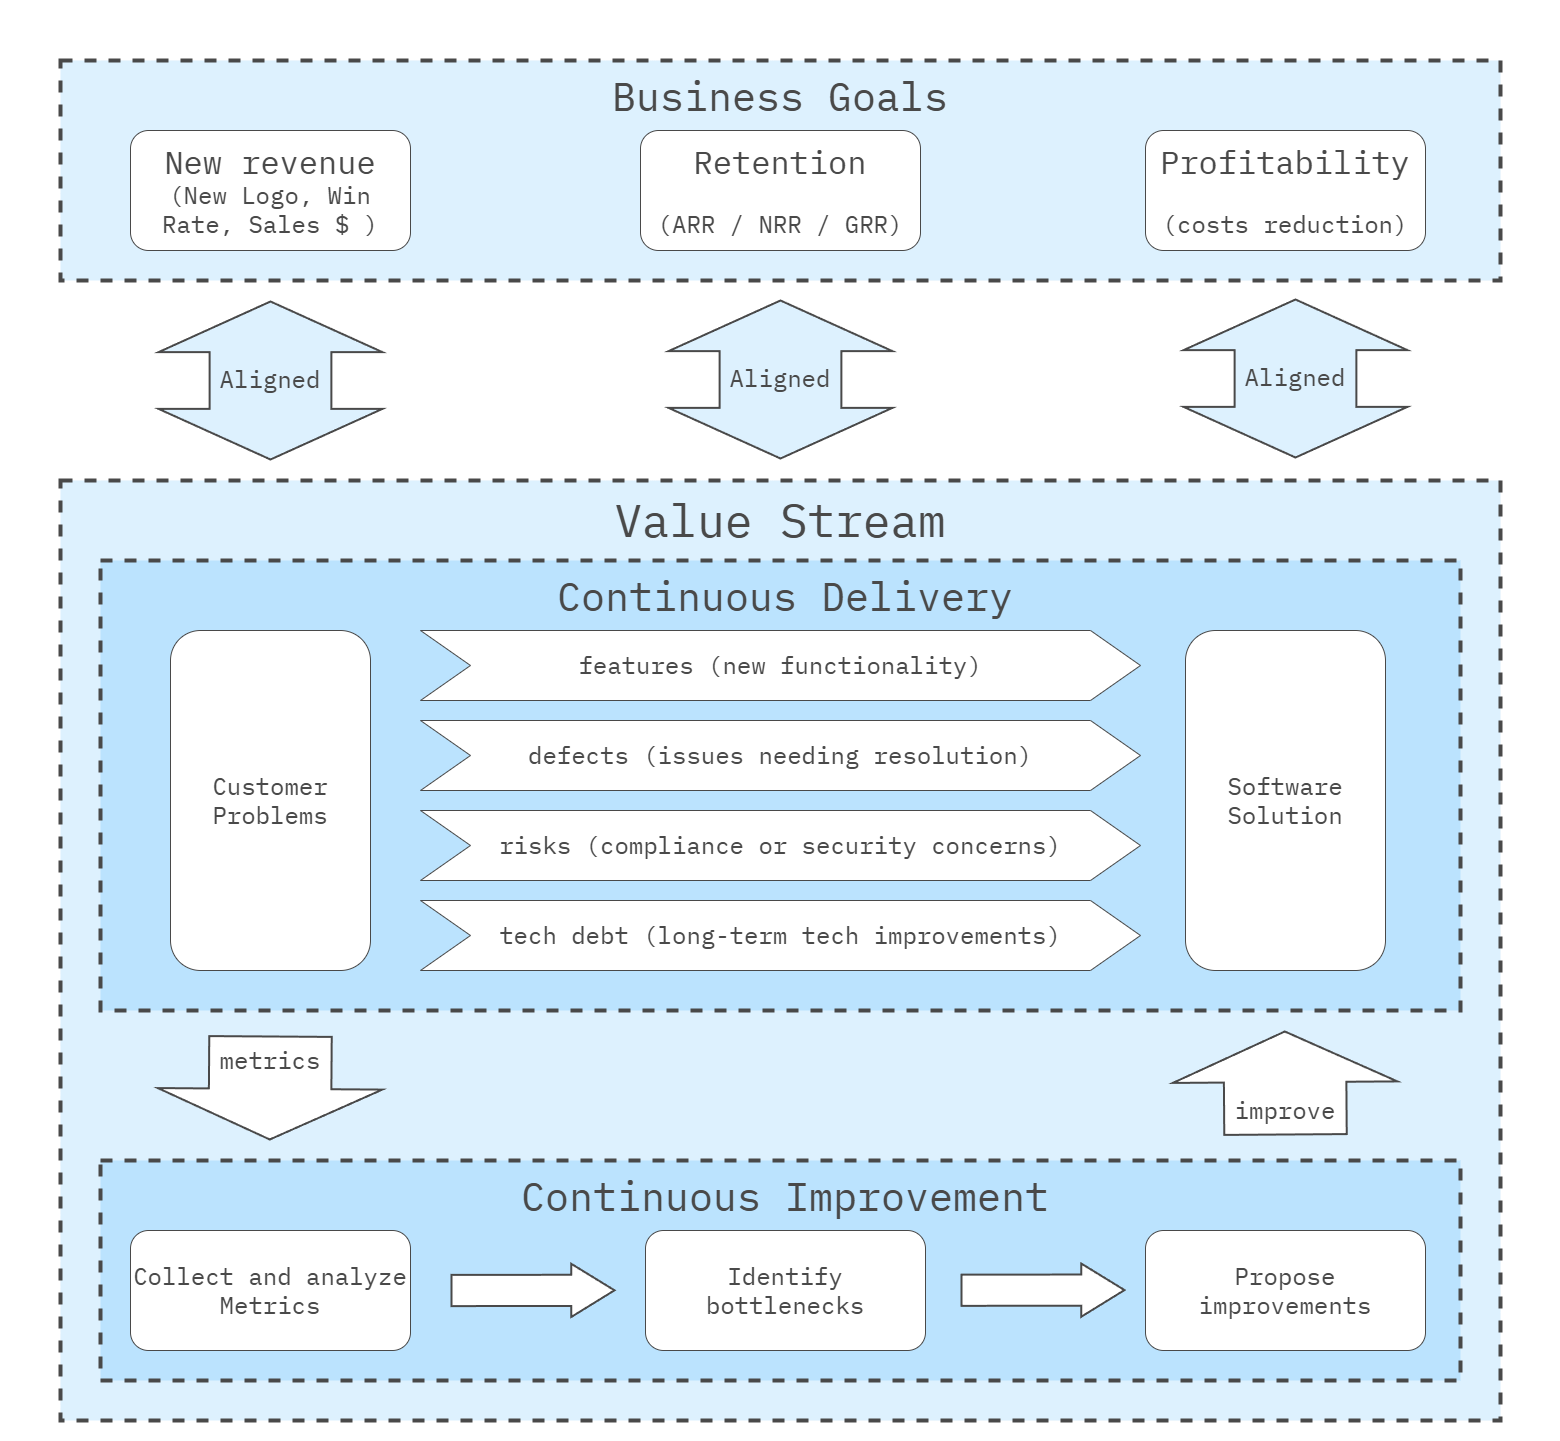
- Flow of work: everything falls into Features, Defects, Risks, or Debt (the four flow items).
- Continuous delivery: streams are ongoing, not projects with an end date.
- Continuous improvement: use flow metrics (velocity, time, efficiency, load, distribution) to reveal bottlenecks.
- Customer-centric: outcome first, activity second.
- Aligned to business goals: the stream’s north-star metric ties to strategy.
The four flow items
- Features: new customer value.
- Defects: restoring expected value.
- Risks: protecting value (security, compliance).
- Debt: sustaining value (capability, quality, cost).
These are the atoms of work that move through a stream.
Measuring flow
- Flow Velocity: items completed per period.
- Flow Time: elapsed time from start to done.
- Flow Load: work in progress; too much creates thrash.
- Flow Efficiency: active vs waiting time.
- Flow Distribution: balance across the four items.
Example: Shopper Purchase Experience
Let’s use the Shopper Purchase Experience Example to illustrate how the core components of a value stream unfold in a real-world journey.
Flow of work
- Features — discover, compare, purchase, receive, return.
Enable shoppers to find relevant products, evaluate options (reviews/specs/price), complete checkout and payment, track delivery, and initiate/complete returns. - Defects — refunds and incomplete flows.
Drop-offs that cannot be resumed, failed or duplicate charges, orders not confirmed, undelivered, or wrong items that require recovery and refunds. - Risks — payment security, fraud, and identity obligations.
PCI/SCA compliance, fraud detection and chargeback handling, identity and access protection, data residency, and auditability are built into the journey. - Debt — cost to run and maintain the service and operations.
Ongoing platform/runtime costs, on-call/support load, observability and reliability work, plus operational costs to maintain catalog data, process orders, handle refunds/returns, and keep policies and integrations current.
Continuous delivery
The Shopper Purchase Experience is a running service. Continuous delivery here means the service is always able to deliver value: it is always available, responsive under load, safe to operate, and capable of processing each transaction end-to-end.
- Always-on journey (discover → compare → purchase → receive → return)
- Handles the needed number of simultaneous customer journeys
- Each journey is isolated and has a consistent end-to-end
- Degrades gracefully if a step slows
Continuous improvement
Continuous improvement is about measuring how the flow performs and tightening the system where it matters most.
- Flow Velocity: journeys completed per period (orders confirmed, returns completed).
- Flow Time: elapsed time from start to done (trigger → value realized).
- Flow Load: work in progress; how many customer journeys are in flight simultaneously.
- Flow Efficiency: active processing vs waiting time between steps (for example, Pay → Confirm waits).
- Flow Distribution: balance across the four items (Features/Defects/Risks/Debt) affecting this stream.
Customer-centric
The stream is judged by the shopper’s outcome, not by internal activity. Success means the shopper finds the right product, completes the purchase smoothly, receives it on time, and can return or request a refund without friction. Design choices prioritize clarity, speed, and trust at each step of the journey.
Aligned to business goals
The north-star metric is conversion: the share of shoppers who complete a purchase. Higher conversion directly increases marketplace commission revenue. Guardrails include refund resolution time, fraud loss rate, cost to serve per order, and on-time delivery rate, so conversion gains don’t degrade trust or unit economics.
Identifying value streams
Value streams are not process steps; they are customer outcomes you can own end-to-end. Identify them by crossing time (trigger → value realized) with who you serve (segments, personas, jobs). Draw boundaries where the outcome, policies, or success measures genuinely differ. Split when those differ; merge when they don’t.
Step by step
1) List customer slices
Goal: Know exactly who you serve.
What needs to happen: Write a short, concrete list of segments/personas you can win, support, and renew.
Expected outcome: 2–5 slices you can point to in your pipeline and roadmap.
2) State the outcome
Goal: Make success observable for each slice.
What needs to happen: One sentence per slice — “We win when {outcome} happens for {slice}.” Use a measurable finish line.
Expected outcome: Clear outcome statements that anchor future metrics.
3) Sketch the timeline
Goal: See the journey end-to-end.
What needs to happen: For each slice, create a Customer Journey Map and list the actual steps they go through with you—from first contact to leaving or expanding. Use the same skeleton for all slices.
Expected outcome: One consistent journey map per slice.
4) Fill the grid
Goal: Replace assumptions with specifics.
What needs to happen: For every cell (slice × step), capture:
- Intent — what the customer is trying to do
- Value delivered — what they tangibly get
- Outcome — how you know the step worked
- Metric — the single measure you’ll track
Expected outcome: A grid that spells out what must be true at each step and how you’ll know.
5) Find material divergences
Goal: Separate real splits from noise.
What needs to happen: Scan across slices and mark only meaningful differences—where the path truly forks (different intent, finish line, proof, cadence, or policy expectations). Keep shared areas merged.
Expected outcome: A small set of justified forks; everything else stays shared.
6) Propose candidate value streams
Goal: Turn journeys into ownable streams.
What needs to happen: For each distinct path, create a Value Stream Card that includes:
- For / Trigger / Finish line / Outcome
- Stages (lightweight, matching the journey skeleton)
- Metrics (north-star + supporting)
- Revenue Streams (how we make money)
- Policies / SLAs / Constraints
- Ownership (what this stream owns vs relies on)
- Key Capabilities & Systems (owned vs used)
- Interfaces / Dependencies
- Typical Risks / Failure Modes
Expected outcome: 2–4 cards that read like team charters.
7) Pull out shared capabilities
Goal: Make common stuff “one and done.”
What needs to happen: List the capabilities that multiple streams require (tools, processes, data, policies). Move them into supporting streams with a concise charter, a brief service list, clear interfaces/SLAs, and an escalation path. Add a simple graduation rule for determining when something becomes shared versus staying product-specific.
Expected outcome: A small set of supporting streams, owned once and measurable.
8) Validate staffing & runability
Goal: Prove the design can operate with your headcount.
What needs to happen:
- Map people to streams and functions.
- Ensure embedded functions have at least two people.
- Confirm each stream has the roles it needs (e.g., Product, AM/CSM, Engineering).
- Check top dependencies have named owners and SLAs in supporting streams.
- If it doesn’t fit, merge/simplify or rebalance headcount.
Expected outcome: A staffed, executable set of streams with clear ownership and no orphaned work.
Decision criteria and checks
- Time integrity: clear start and finish with proof points.
- Customer clarity: specific segment/persona/job with a single north-star metric.
- Policy and SLA deltas: materially different obligations justify a separate stream.
- Cadence and learning: very different change rhythms or risk posture suggest separation.
- Blast radius: failures remain local to the stream.
- Simplicity: a new leader can explain the map in under a minute.
Order example
Manufacturing treats “Order-to-Ship” as one process lane. In software, the shopper’s outcome spans discover → compare → purchase → receive → return. That is one stream for consumer buyers when the trigger, finish line, and success metric (conversion to completed delivery) are the same.
Enterprise procurement may diverge: formal quotes, POs, tax exemptions, delivery windows, different finish line (invoice approved, goods received), and a different north-star metric. That becomes a separate stream, even though both include “order”, because the outcome, policies, and measure of success differ.
Value streams vs revenue streams
A revenue stream captures value for the business; a value stream delivers value to customers. Many value streams generate revenue, but some (e.g., compliance or internal enablement) do not and are still essential to sustained delivery. You can reverse-engineer value streams by following revenue: track what customers pay for and how it is delivered to surface under-recognized or under-resourced streams.
Top-level and supporting streams
Top-level streams align to distinct customer value (e.g., Electric Vehicles, Trucks and SUVs, Fleet Sales), each with its own customers, products, pipelines, metrics, and risks: even when underlying parts overlap. Supporting streams (e.g., Engine Production, Battery Cell Assembly, Software Updates for In-Vehicle Systems) provide shared capabilities critical to delivering those customer-facing streams.
Example
The Shopper Purchase Experience stream relies on Payments (supporting) for tokens, fraud, and settlement, as well as the Platform for deployment and observability. These are streams, too, but supporting ones.
Architectural impact of value stream boundaries
Value streams shape architecture indirectly, through funding, management, and team boundaries, and directly via choices about centralized versus distributed capabilities. Defining Internal/Supporting Value Streams is an explicit decision to manage specific capabilities centrally and offer them as a service to Customer Value Streams (for example, platform, identity, observability, data, billing, CRM, onboarding). Architectural seams then follow: standardized contracts, shared controls, and multi-tenant isolation around those shared services. Suppose you don’t establish shared/supporting streams. In that case, the centralization impulse doesn’t vanish—it’s often recreated inside each Customer Value Stream as a small “mini-platform” with its own paved road and internal contracts.
Shared vs Owned
- Shared capabilities — Centralized, funded, and staffed once; offered self-service to all streams. This consolidates expertise, enhances consistency, and fosters uniform integration and control patterns.
- Owned capabilities — Embedded within a stream and tailored to its outcomes and obligations. This maximizes autonomy and pace, but risks duplication and divergence across streams.
The shared-vs-owned split is most forceful in infrastructure. A shared platform pushes standardized runtimes, security, and telemetry with strong guardrails; stream-owned stacks push isolation by default, bespoke topologies, independent release trains, and strong boundaries to avoid tight coupling.
Where the boundary shows up in the system
Each item can be shared across streams or owned within a stream. Your choice sets the seams, contracts, and quality attribute tactics.
User experience (shell, design system, UIs)
Treat the UX layer as your front door. Shared provides a single shell and design system where streams plug in features, ensuring consistency and accessibility come for free. Owned lets each stream shape its UI to fit its journey, emphasizing speed and specialization, but allowing for more divergence. Implication: define navigation contracts, theming tokens, and who controls shell version bumps.Identity and access (authN/Z, roles, entitlements)
Identities span the whole product. Shared centralizes sign-in, tokens, and entitlements for a single audit plane. Owned refines roles and entitlements to match a stream’s outcomes. Implication: declare the entitlements source of truth, document cache and validation rules, and prevent policy drift.Integration and events (APIs, messages, workflows)
Boundaries need clarity. Shared gateways and buses standardize auth, retries, idempotency, and schemas. Owned choreography favors decoupling and responsiveness. Implication: prefer asynchronous edges at stream seams; when synchronous is required, keep contracts explicit and versioned.Infrastructure and runtime (compute, network, storage, CI/CD)
This is the canonical driver. Shared provides a paved road for clusters, pipelines, secrets, policy-as-code, and guardrails. Owned tailors stacks to segment needs with independent release trains and scaling. Implication: this choice defines isolation, blast radius, and the smallest unit you can scale.Security, compliance, and policy (audit, residency, keys)
Controls must be provable. Shared centralizes evidence such as key management, audit trails, and residency policies. Owned tightens controls where obligations differ. Implication: Map obligations to deployment topologies and document which controls are platform-specific versus stream-specific.Observability and SLOs (logs, traces, metrics, flow checkpoints)
You can’t improve what you can’t see. Shared telemetry unifies dashboards and SLO templates. Owned sharpens signals for local needs. Implication: Regardless of ownership, emit events at business proof points so the flow from trigger to value is visible end-to-end.Release and delivery tooling (build, deploy, approvals)
Delivery is culture in code. Shared pipelines enforce provenance, SBOMs, and policy checks. Owned pipelines tune for pace and context. Implication: Establish minimum standards for security and compliance, even when streams customize their path.Failure domains and scaling (isolation, capacity, hot paths)
Boundaries decide blast radius. Shared multi-tenant setups require strong partitioning to prevent widespread outages. Owned isolates by default and scales only the hot path. Implication: design day-to-day isolation first; do disaster recovery and backups per boundary, not as a substitute for good compartmentalization.Analytics and reporting (metrics, models, BI)
Decisions need consistent numbers. Shared warehouses and metric layers define canonical KPIs. Owned models answer stream-specific questions. Implication: declare which KPIs are global versus local and publish metric-logic contracts.Billing (pricing, invoices, payments, refunds)
Money flows demand rigor. Shared ledgers and payment integrations provide controls and reconciliation. Owned variations, such as plans and promotions, sit closer to the stream’s journey with settlement back to the ledger. Implication: model money events (for example, Charge Captured, Refund Issued) so streams integrate without tight coupling.CRM and customer records (accounts, contacts, entitlements)
Think of CRM as the golden source of customer truth. Shared publishes clean, versioned read models to all streams. Owned keeps an augmented view tailored to journeys while deferring canonical fields to the shared source. Implication: declare golden fields, emit change-data events, and keep stream enrichments additive, not authoritative.Customer onboarding and provisioning (KYC, setup, policy checks)
First impressions set the tone. Shared reusable workflows apply segment-aware policies centrally. Owned handles niche steps for specific personas. Implication: Expose onboarding states and events so that downstream streams can progress without synchronous blocking.
What architects optimize
- Map ownership to design — Make platform/shared versus stream-owned responsibilities unambiguous; don’t let ambiguity leak into code.
- Seal the seams — Define narrow, versioned contracts (events and APIs); prefer asynchronous edges at stream boundaries.
- Protect the data — Place writes where the outcome lives; publish read models elsewhere.
- Tune by obligations — Let policy and SLA deltas (latency, audit, residency) drive topology and controls per stream.
- Contain blast radius — Isolate runtime, state, and deployment units so incidents remain local.
- Instrument the flow — Track Flow Time, Velocity, Load, Efficiency, and Distribution per stream, with checkpoints tied to business proof points.
- Keep platforms thin — If shared, provide a paved road and guardrails, not business logic. If stream-owned, avoid accidentally rebuilding a heavy platform; standardize just enough.
Managing Value Streams Over Time
Value streams evolve as products, teams, and technologies change. Continuous monitoring and improvement keep them aligned with business goals. A connected value stream network, which includes the tools and processes through which work flows, supports this visibility. Organizing around a product model aligns teams, technology, and goals to a shared product vision, ensuring the stream’s structure reflects the outcomes it owns.
Evolving Streams
As markets and technology shift, streams change. In the automotive domain, subscription-based software services (such as real-time navigation, premium audio, remote diagnostics, and over-the-air updates) can crystallize into a distinct stream: Digital Experience and Connected Services, with its own tech stacks, teams, and customer interactions. A practical operating cadence is to review your value-stream map every six months or after major market shifts.
Conclusion
Value streams describe the customer’s journey to value—start to finish—not the mechanics of software delivery. Each stream is an end-to-end outcome you own over time: a coherent journey for a defined segment where “value realized” is unambiguous.
Identify streams with a simple map of time × customer. It clarifies triggers, proof points, and policies, exposes clean seams, and yields the smallest proper set of streams. Run each stream as an always-on service and measure the journey itself: flow velocity, flow time, flow load, flow efficiency, and flow distribution. These signals tell you where customers wait, where work piles up, and what to change next.
Design shared versus owned capabilities deliberately, seal seams with explicit contracts and events, and keep platforms thin. Review streams on a regular cadence, adjust boundaries as markets and obligations change, and sustain them with dedicated teams and lightweight governance.
Organize funding and work around streams—not projects—and use the flow metrics to continuously steer the customer journey toward outcomes that matter.
Recommended reading
Kersten, M. (2018). Project to Product: How to Survive and Thrive in the Age of Digital Disruption with the Flow Framework. IT Revolution Press.
- Chapter 3: Introducing the Flow Framework
Provides the core framing of value streams and the four flow items, shifting attention from activity management to value flow and alignment with business outcomes. - Chapter 4: Capturing Flow Metrics
Defines the flow metrics—velocity, time, load, efficiency, and distribution — and explains how they create transparency and reveal bottlenecks. - Chapter 9: Value Stream Management
Emphasizes continuous improvement, the value stream network, and the product model to keep streams aligned with evolving business goals.
- Chapter 3: Introducing the Flow Framework
Pereira, S., & Davis, A. (2024). Flow Engineering: From Value Stream Mapping to Effective Action.
- Chapter 5: Outcome Mapping
Aligns teams on measurable outcomes and signals of success before modifying the system, thereby anchoring all subsequent maps. - Chapter 6: Current State Value Stream Mapping
Makes today’s flow visible end-to-end to expose delays, rework, and handoffs that slow customer journeys. - Chapter 7: Dependency Mapping
Surfaces cross-team and external constraints, illustrating how platforms, policies, and vendors influence the flow of information. - Chapter 8: Future State Value Stream Mapping
Designs a target flow with fewer waits and clearer ownership, tied to outcomes rather than outputs. - Chapter 9: The Flow Roadmap
Converts insights from the four maps into sequenced, owned experiments with success measures and review cadence.
- Chapter 5: Outcome Mapping